University Chemistry ›› 2024, Vol. 39 ›› Issue (1): 340-350.doi: 10.3866/PKU.DXHX202305077

• Self Studies • Previous Articles     Next Articles

Accurate Plotting of Acid-Base Titration Curve and Calculation of Titration Endpoint Errors by GeoGebra

Hongyi Zhang1,2,*(), Junyao He1, Zhihong Shi1,2   
  1. 1 College of Chemistry and Materials Science, Hebei University, Baoding 071002, Hebei Province, China
    2 Teaching Institute for Chemistry, Hebei University, Baoding 071002, Hebei Province, China
  • Received:2023-05-26 Accepted:2023-08-07 Published:2023-08-14
  • Contact: Hongyi Zhang E-mail:hyzhang@email.com

Abstract:

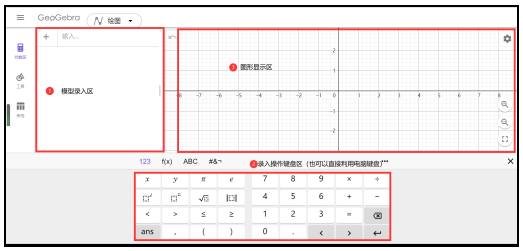
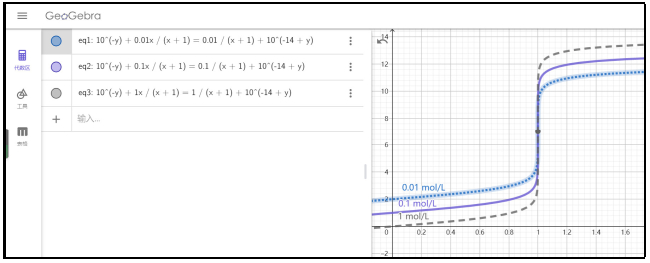
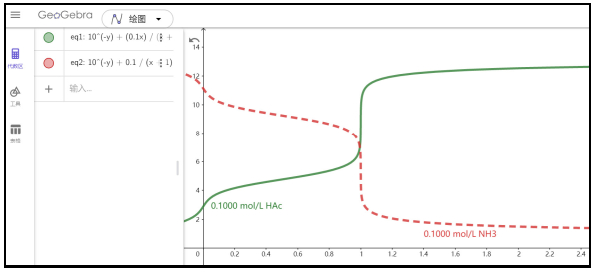
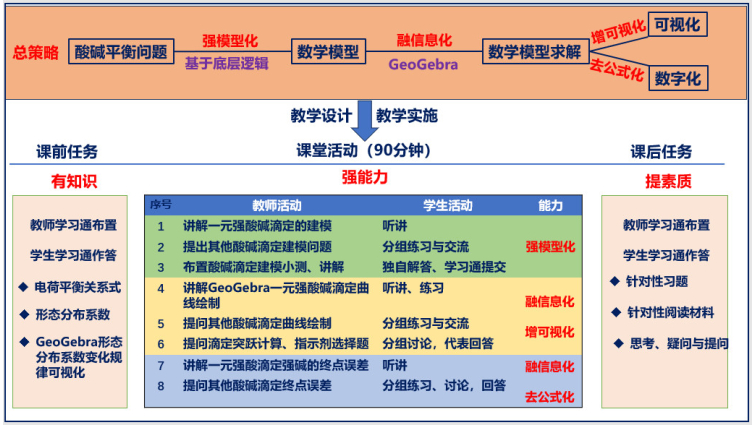
Both acid-base titration curve and titration end point error are two important teaching contents in the chapter of acid-base titration in analytical chemistry textbook. In view of the above two problems, it is proposed that a new general teaching strategy of 'strengthening of modeling capability, integrating of information technology into analytical chemistry, enhancement of visualization and avoiding of formularization memory'. The strategy is carried out in two steps. Specifically, in the first step, the acid-base titration problem is converted into a mathematic model by means of three underlying logic tools, namely charge balance equation, dilution law and distribution coefficient of species. The building modeling process is referred to as three-step modeling method. In the second step, visualization and digital solution on the built models are realized by the aid of GeoGebra software.

Key words: Modeling of titration problem, Integrating of information technology into course, Enhancing of visualization for regulation, Avoiding of formularization memory, GeoGebra software